The price of Ethereum remains in a consolidation phase, but is showing signs of accumulation, which may lead to a bullish breakout.
Ethereum (ETH) was trading at around $2,500 at the last check on Saturday, July 5, within a narrow range it has maintained since May.
Third-party data shows that whales and Wall Street investors have increased their Ethereum positions in the past few months. SoSoValue shows that spot ETH ETFs added over $219 million in assets this week, continuing a trend that started in May. It was the eighth consecutive week of inflows, a sign that these investors expect its price to rebound.
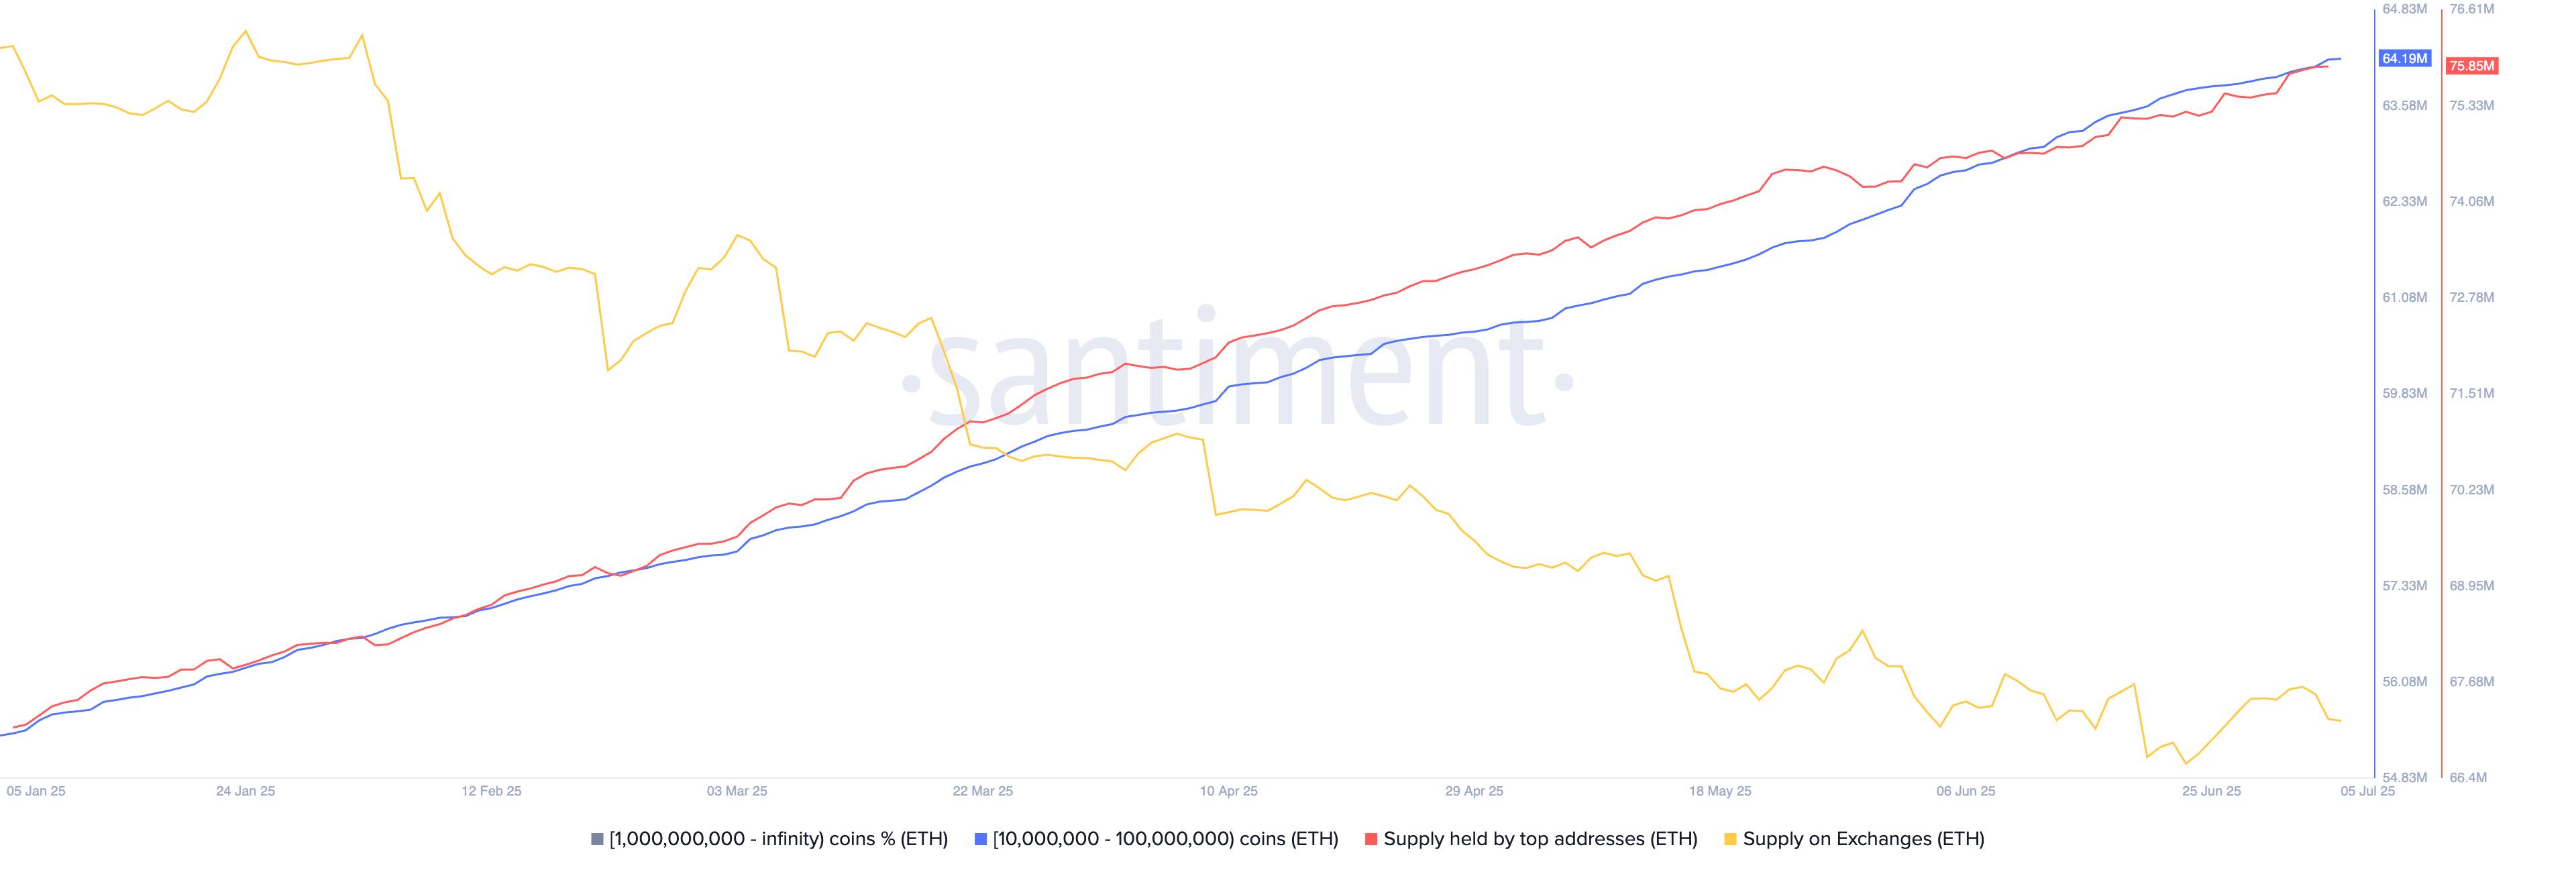
More data indicates that whales continued to buy Ethereum this week, with addresses holding between 10 million and 100 million tokens increasing their positions to 64 million tokens.
Similarly, as the chart below shows, the supply held by top addresses continued its strong uptrend, reaching a high of 75.6 million.
Ethereum balances on exchanges fall, staking levels rise
There are now 7.3 million ETH tokens on exchanges. That’s down from 10.73 million in February. Falling exchange balances is a sign that investors continue moving their coins to self-custody.

More investors are staking their ETH coins. StakingRewards data shows a net increase of 2 million coins, worth over $4 billion, in staking pools. This increase has pushed the staking ratio to 29.45% and the staking market cap to nearly $90 billion.
The ETH outflow from exchanges, coupled with rising staking, signals a shift from short-term trading toward long-term holding and yield generation. It reflects increased trust in Ethereum’s ecosystem, rising decentralization, and a maturing investor base.
Ethereum price technical analysis

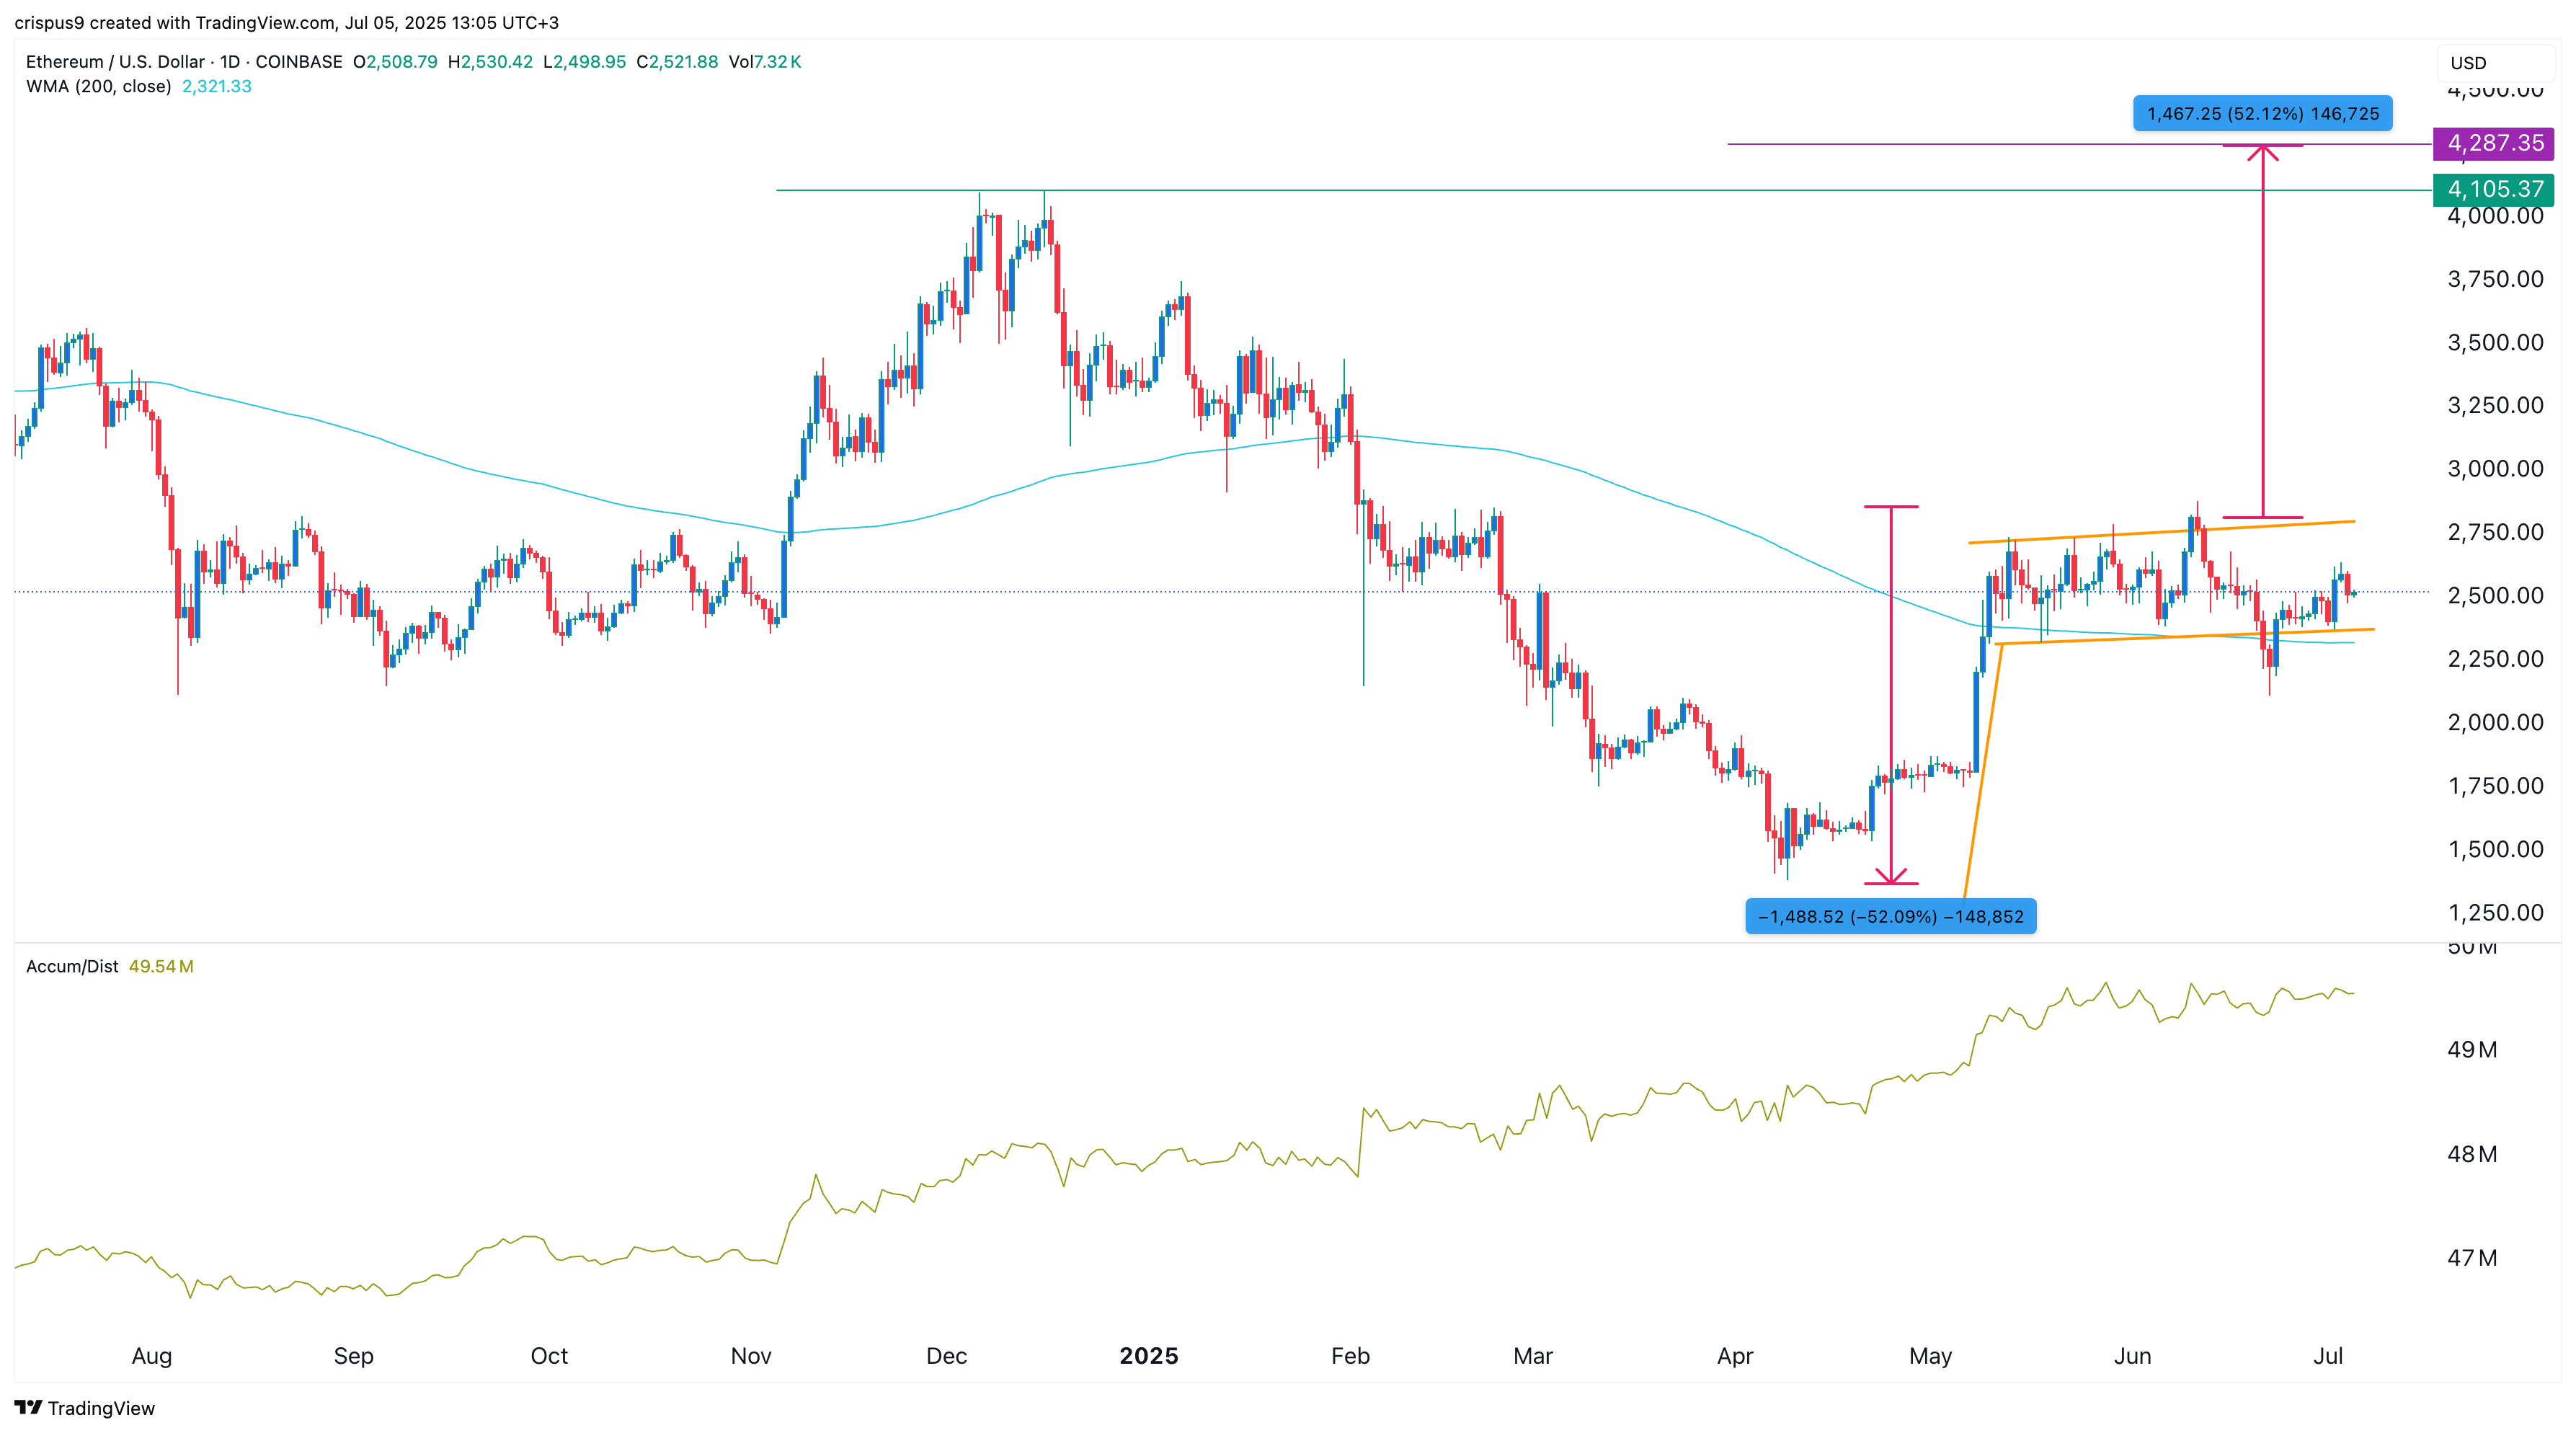
The daily chart shows that Ethereum price has remained in a tight range since May this year. The accumulation and distribution indicator has continued rising and is hovering near its highest level this year.
Ethereum has formed a bullish flag pattern, comprising a vertical line and a horizontal consolidation. This pattern often leads to a strong bullish breakout, equivalent to the height of the flagpole.
In this case, the flagpole has a height of about 52%, and measuring it from the breakout point gives a target price of $4,287. Gains to that target level will be confirmed if it rises above last year’s high of $4,100.
The bullish Ethereum price forecast will become invalid if it drops below the psychological point at $2,000.
