Bitcoin has rebounded toward $83.3K after another test of nearby demand, but the recovery remains below the broken trendline support. Renewed big-whale spot activity adds another factor to watch, as large orders could introduce selling pressure while BTC struggles to reclaim resistance.
Bitcoin Price Analysis: The Daily Chart
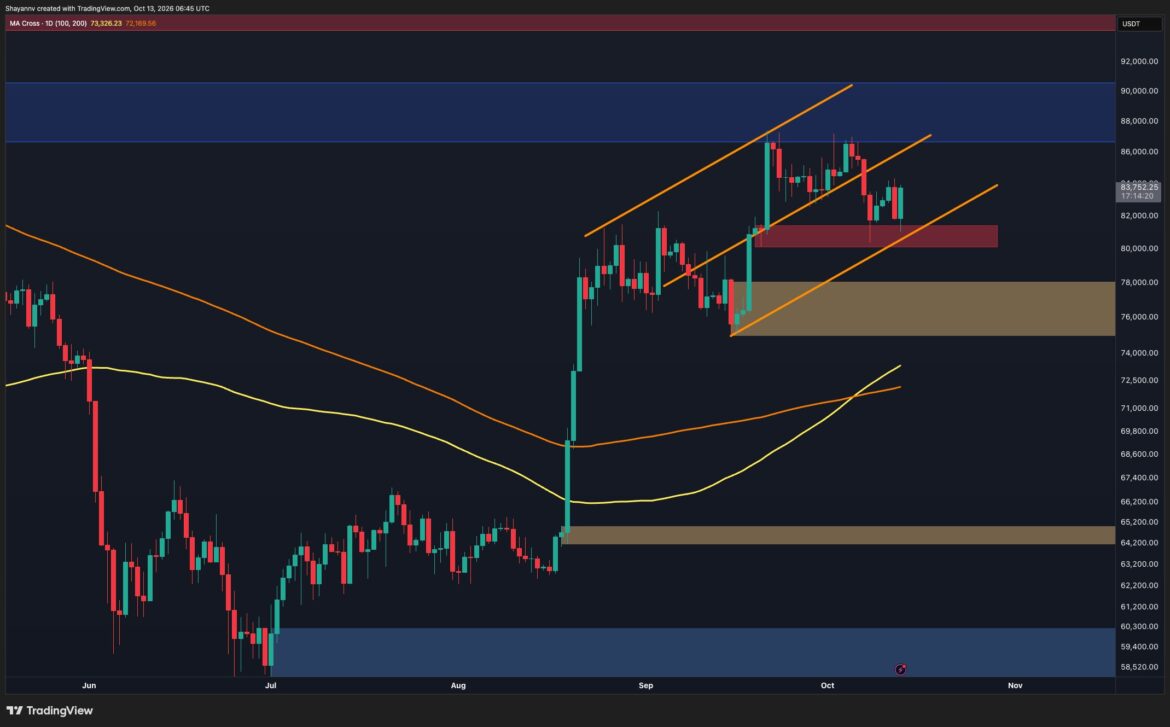
On the daily timeframe, Bitcoin’s rejection from the $86.5K–$90.5K resistance zone has led to a correction into the lower portion of its ascending structure. Buyers have responded around the highlighted $80K–$81.5K demand zone, producing a rebound toward $83.3K. However, the price remains below the rising middle trendline, suggesting that the recovery has yet to reverse the recent structural weakness.
The broader backdrop remains supported by the moving averages. The 100-day average, near $73.3K, is above the 200-day average around $72.2K, maintaining the confirmed bullish crossover. Nevertheless, these averages sit well below the price and offer limited protection against another near-term decline.
Holding the $80K–$81.5K demand zone and the nearby lower ascending boundary would preserve the possibility of a recovery toward $85K–$87K. A sustained reclaim of this region could bring the broader $86.5K–$90.5K supply zone back into focus. Conversely, a decisive loss of $80K would weaken the ascending structure and expose the next major demand area at $75K–$78K.
BTC/USDT 4-Hour Chart
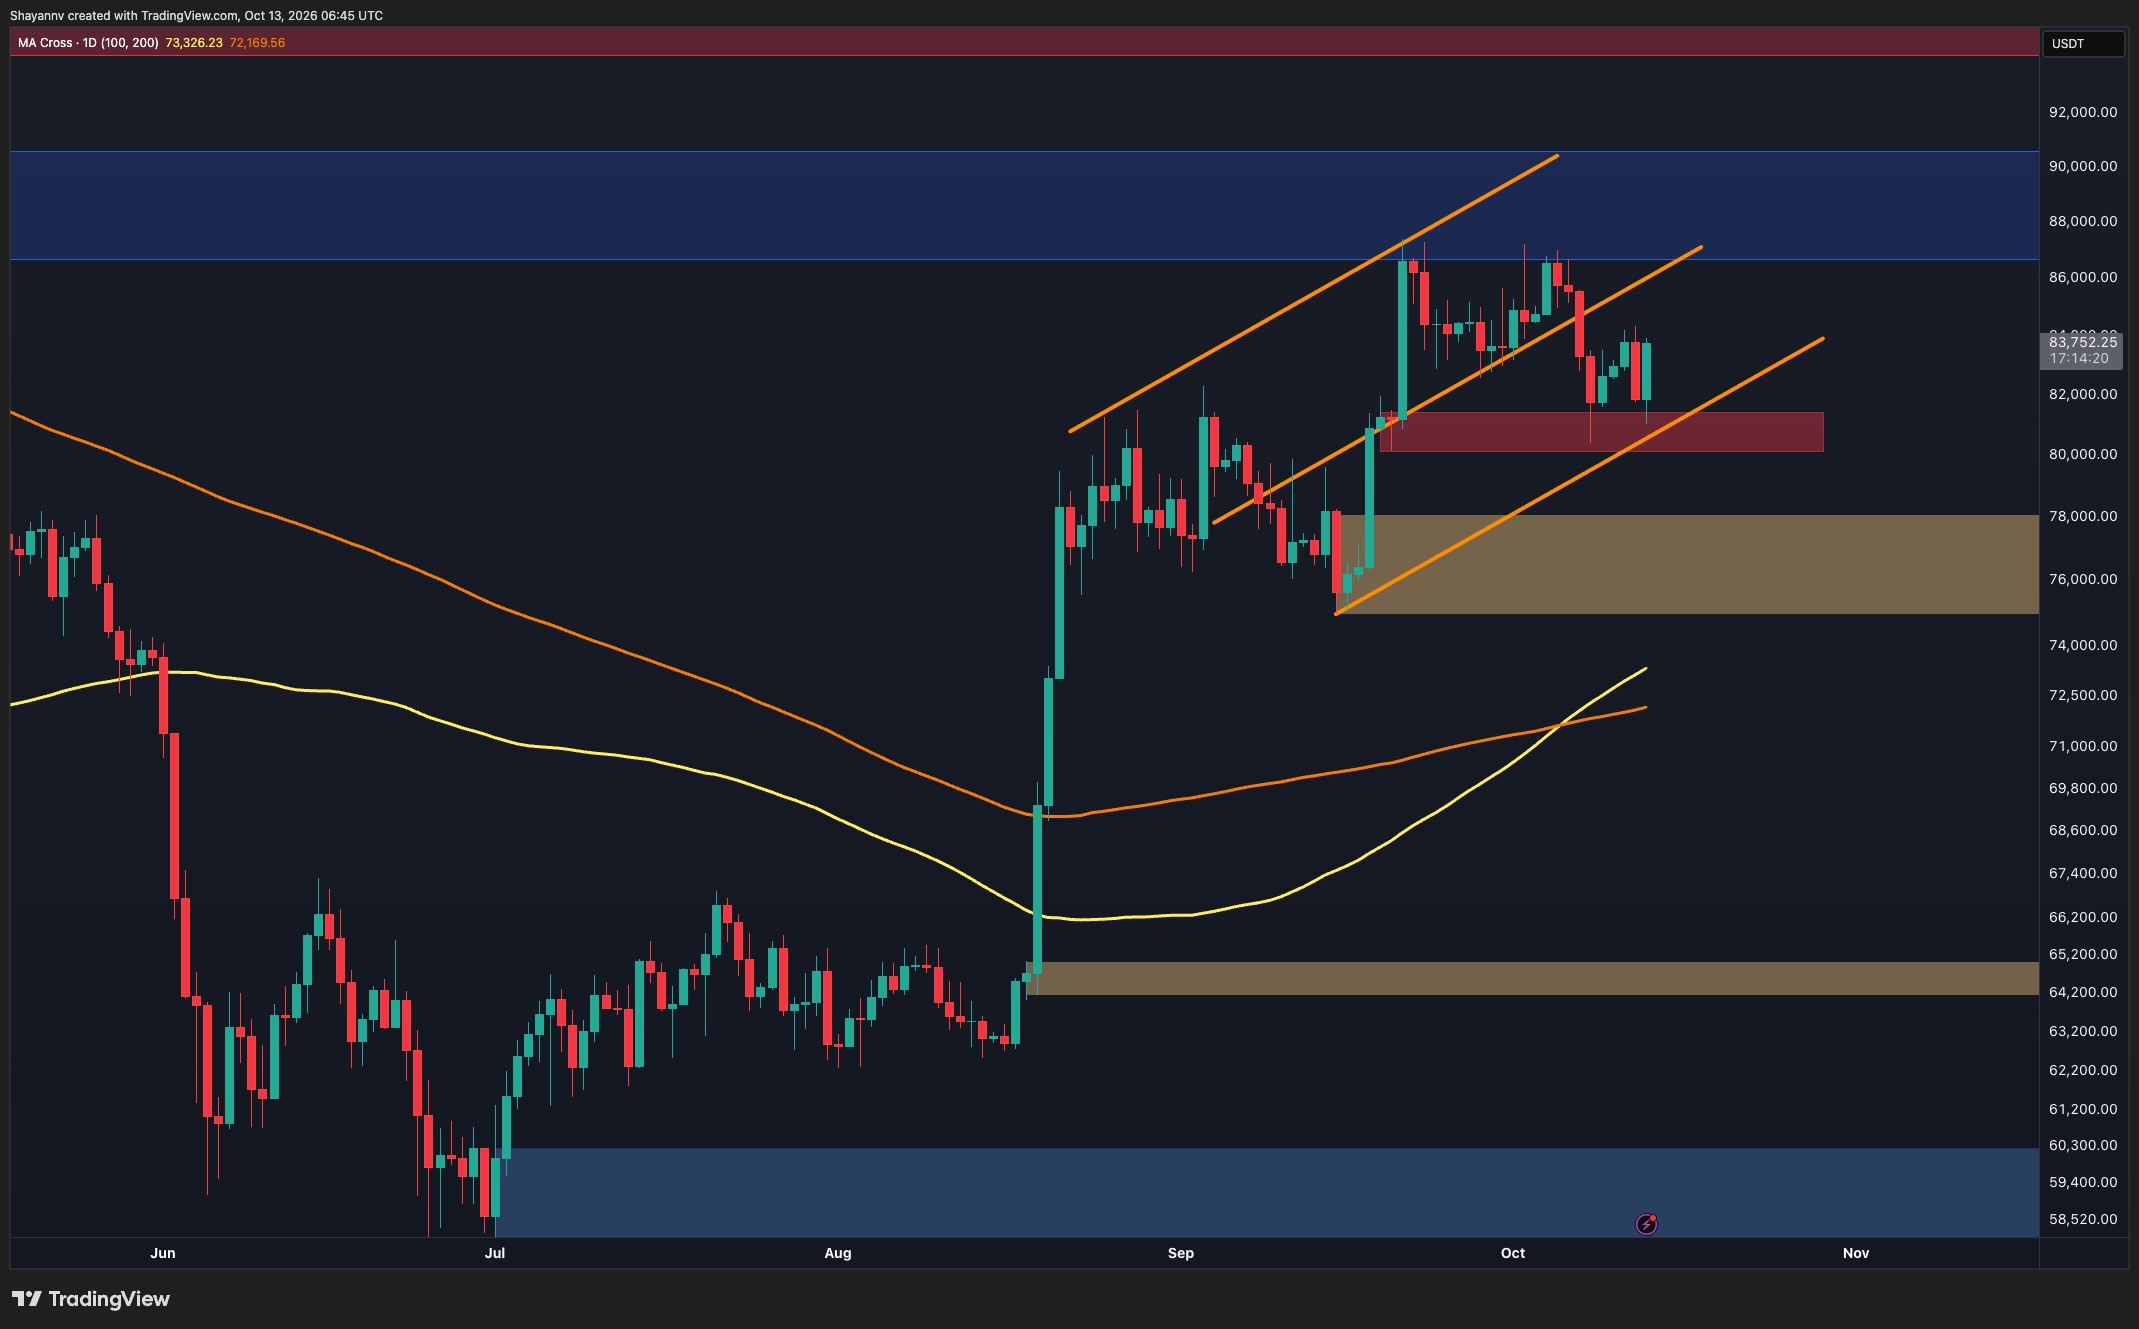
The 4-hour chart shows Bitcoin trading below the ascending trendline that previously supported its advance. Following the breakdown, the price has tested the $80K–$81.5K demand zone twice, with both visits attracting buying interest. The latest rebound has carried BTC toward $83.3K, although it remains near the recent rebound highs around $84K.
A sustained move above $84K could support an advance toward the highlighted $85K–$86.7K supply zone. This area contains the consolidation preceding the selloff and represents an important barrier to restoring bullish momentum. Until buyers reclaim it, the rebound remains vulnerable to forming another lower high.
On the downside, losing the recent $81K–$81.5K lows would put the lower boundary of demand around $80K under pressure. A confirmed break beneath the entire zone could extend the correction toward $78K and the broader $75K–$78K support area.

Sentiment Analysis
The Bitcoin Spot Average Order Size chart shows renewed big-whale readings during the recent price action around $82K–$87K. These readings indicate larger average spot trades and suggest that large participants are actively involved as Bitcoin consolidates below resistance.
Their presence could introduce meaningful selling pressure if these larger orders represent distribution or profit-taking. With BTC already trading below its broken trendline, whale selling into rebounds could limit upside follow-through and increase the risk of another test of the $80K–$81.5K demand zone.
However, average order size does not reveal trade direction, so the green readings alone cannot confirm whale selling. The key concern is whether continued large-order activity coincides with failed recoveries and fresh downside breaks. Such behavior would strengthen the distribution scenario, while a sustained reclaim of the $85K–$86.7K supply zone would weaken it.

The post Bitcoin Price Analysis: More Danger Ahead as BTC Remains Below Broken Trendline? appeared first on CryptoPotato.
