Bitcoin remains in a neutral-to-bullish consolidation phase, fluctuating between its 100- and 200-day moving averages. The $116K barrier is now the key resistance for continuation, while the $109K region defines the bullish invalidation threshold.
Until one of these levels is decisively breached, the market is likely to oscillate within the current range, accumulating liquidity ahead of its next impulsive move.
Technical Analysis
By Shayan
The Daily Chart
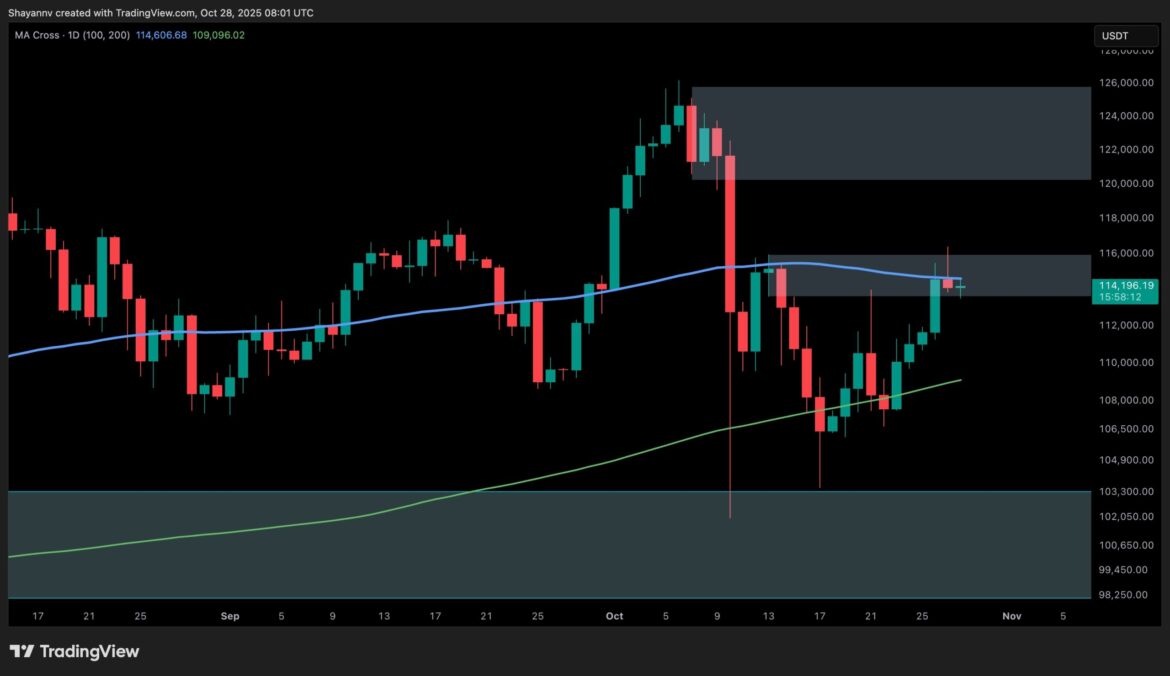
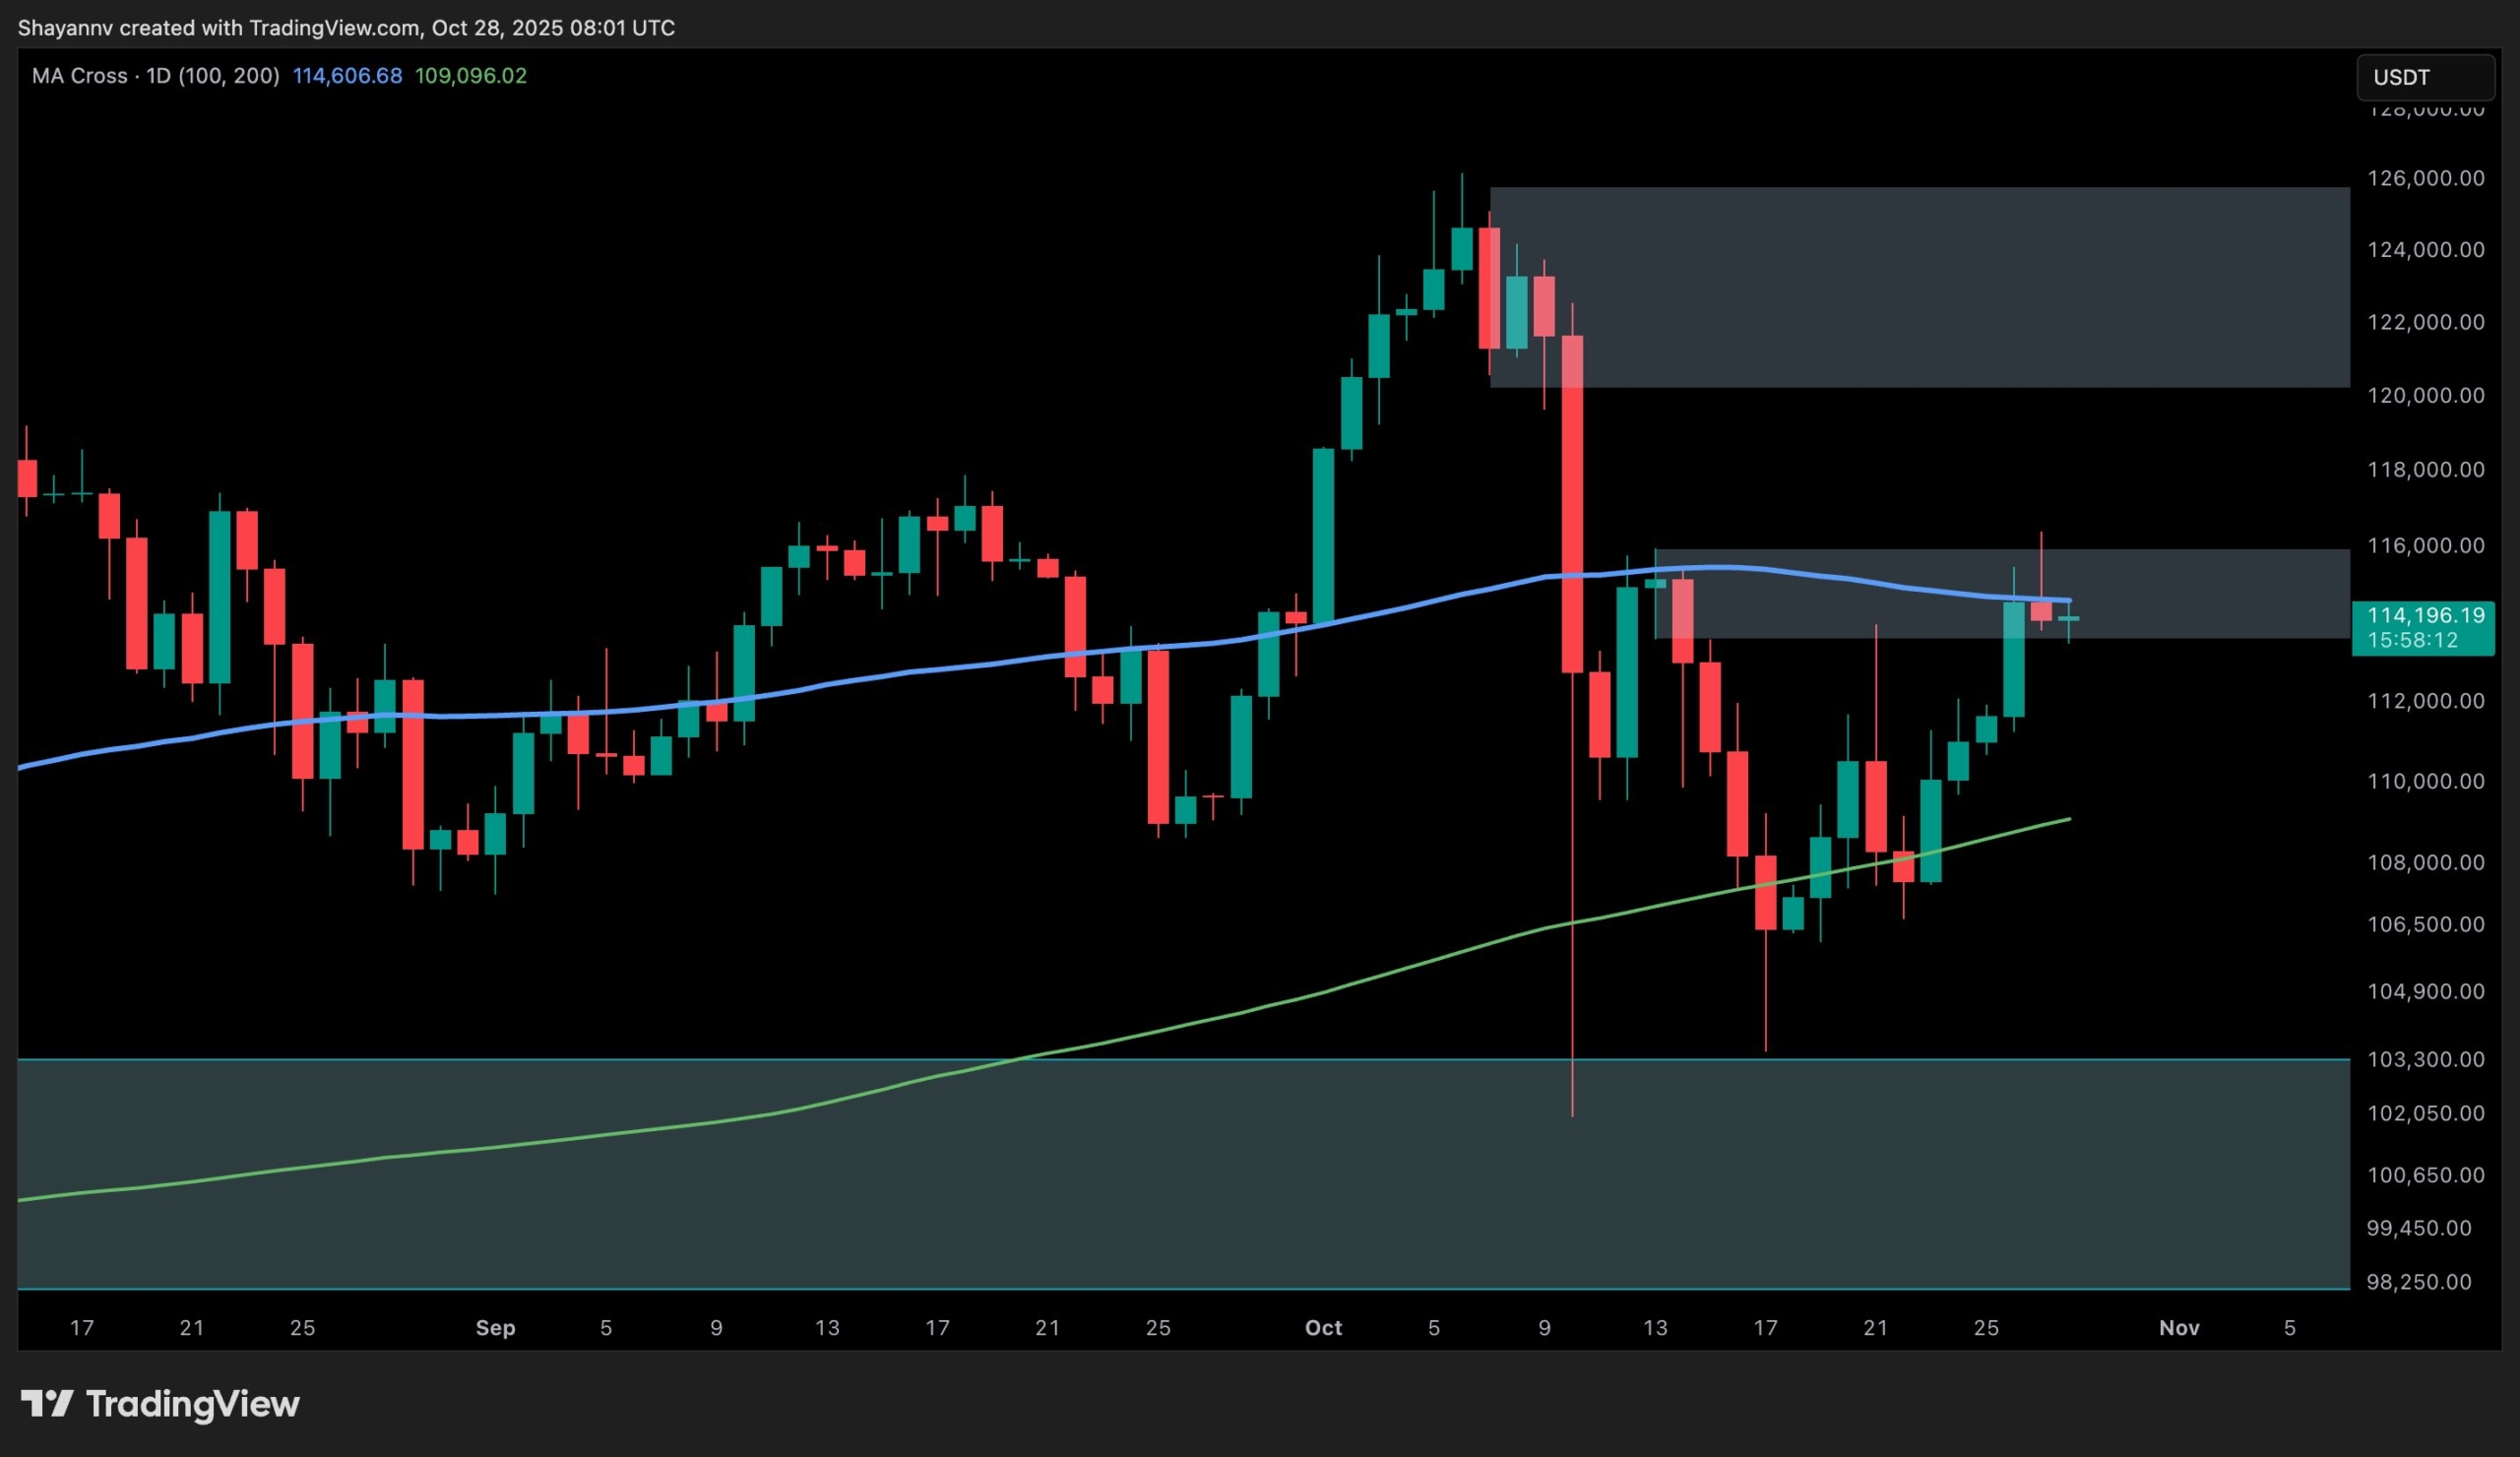
On the daily timeframe, Bitcoin has rebounded strongly from the $109K support region, aligned with the 200-day MA, reclaiming several key short-term levels. The recent upswing has brought the price directly into the $114K–$116K resistance zone, which coincides with the 100-day moving average.
This area represents a crucial inflection point: a sustained close above $116K would confirm a structural shift and likely drive continuation toward the $120K–$122K supply zone. However, the rejection candle forming near the 100-day MA highlights lingering selling pressure from short-term holders.
As long as the asset remains trapped between the 100- and 200-day MAs, Bitcoin is expected to extend its consolidation phase, building energy for the next major trend expansion. The $109K–$110K region remains the key defense line for bulls.
The 4-Hour Chart
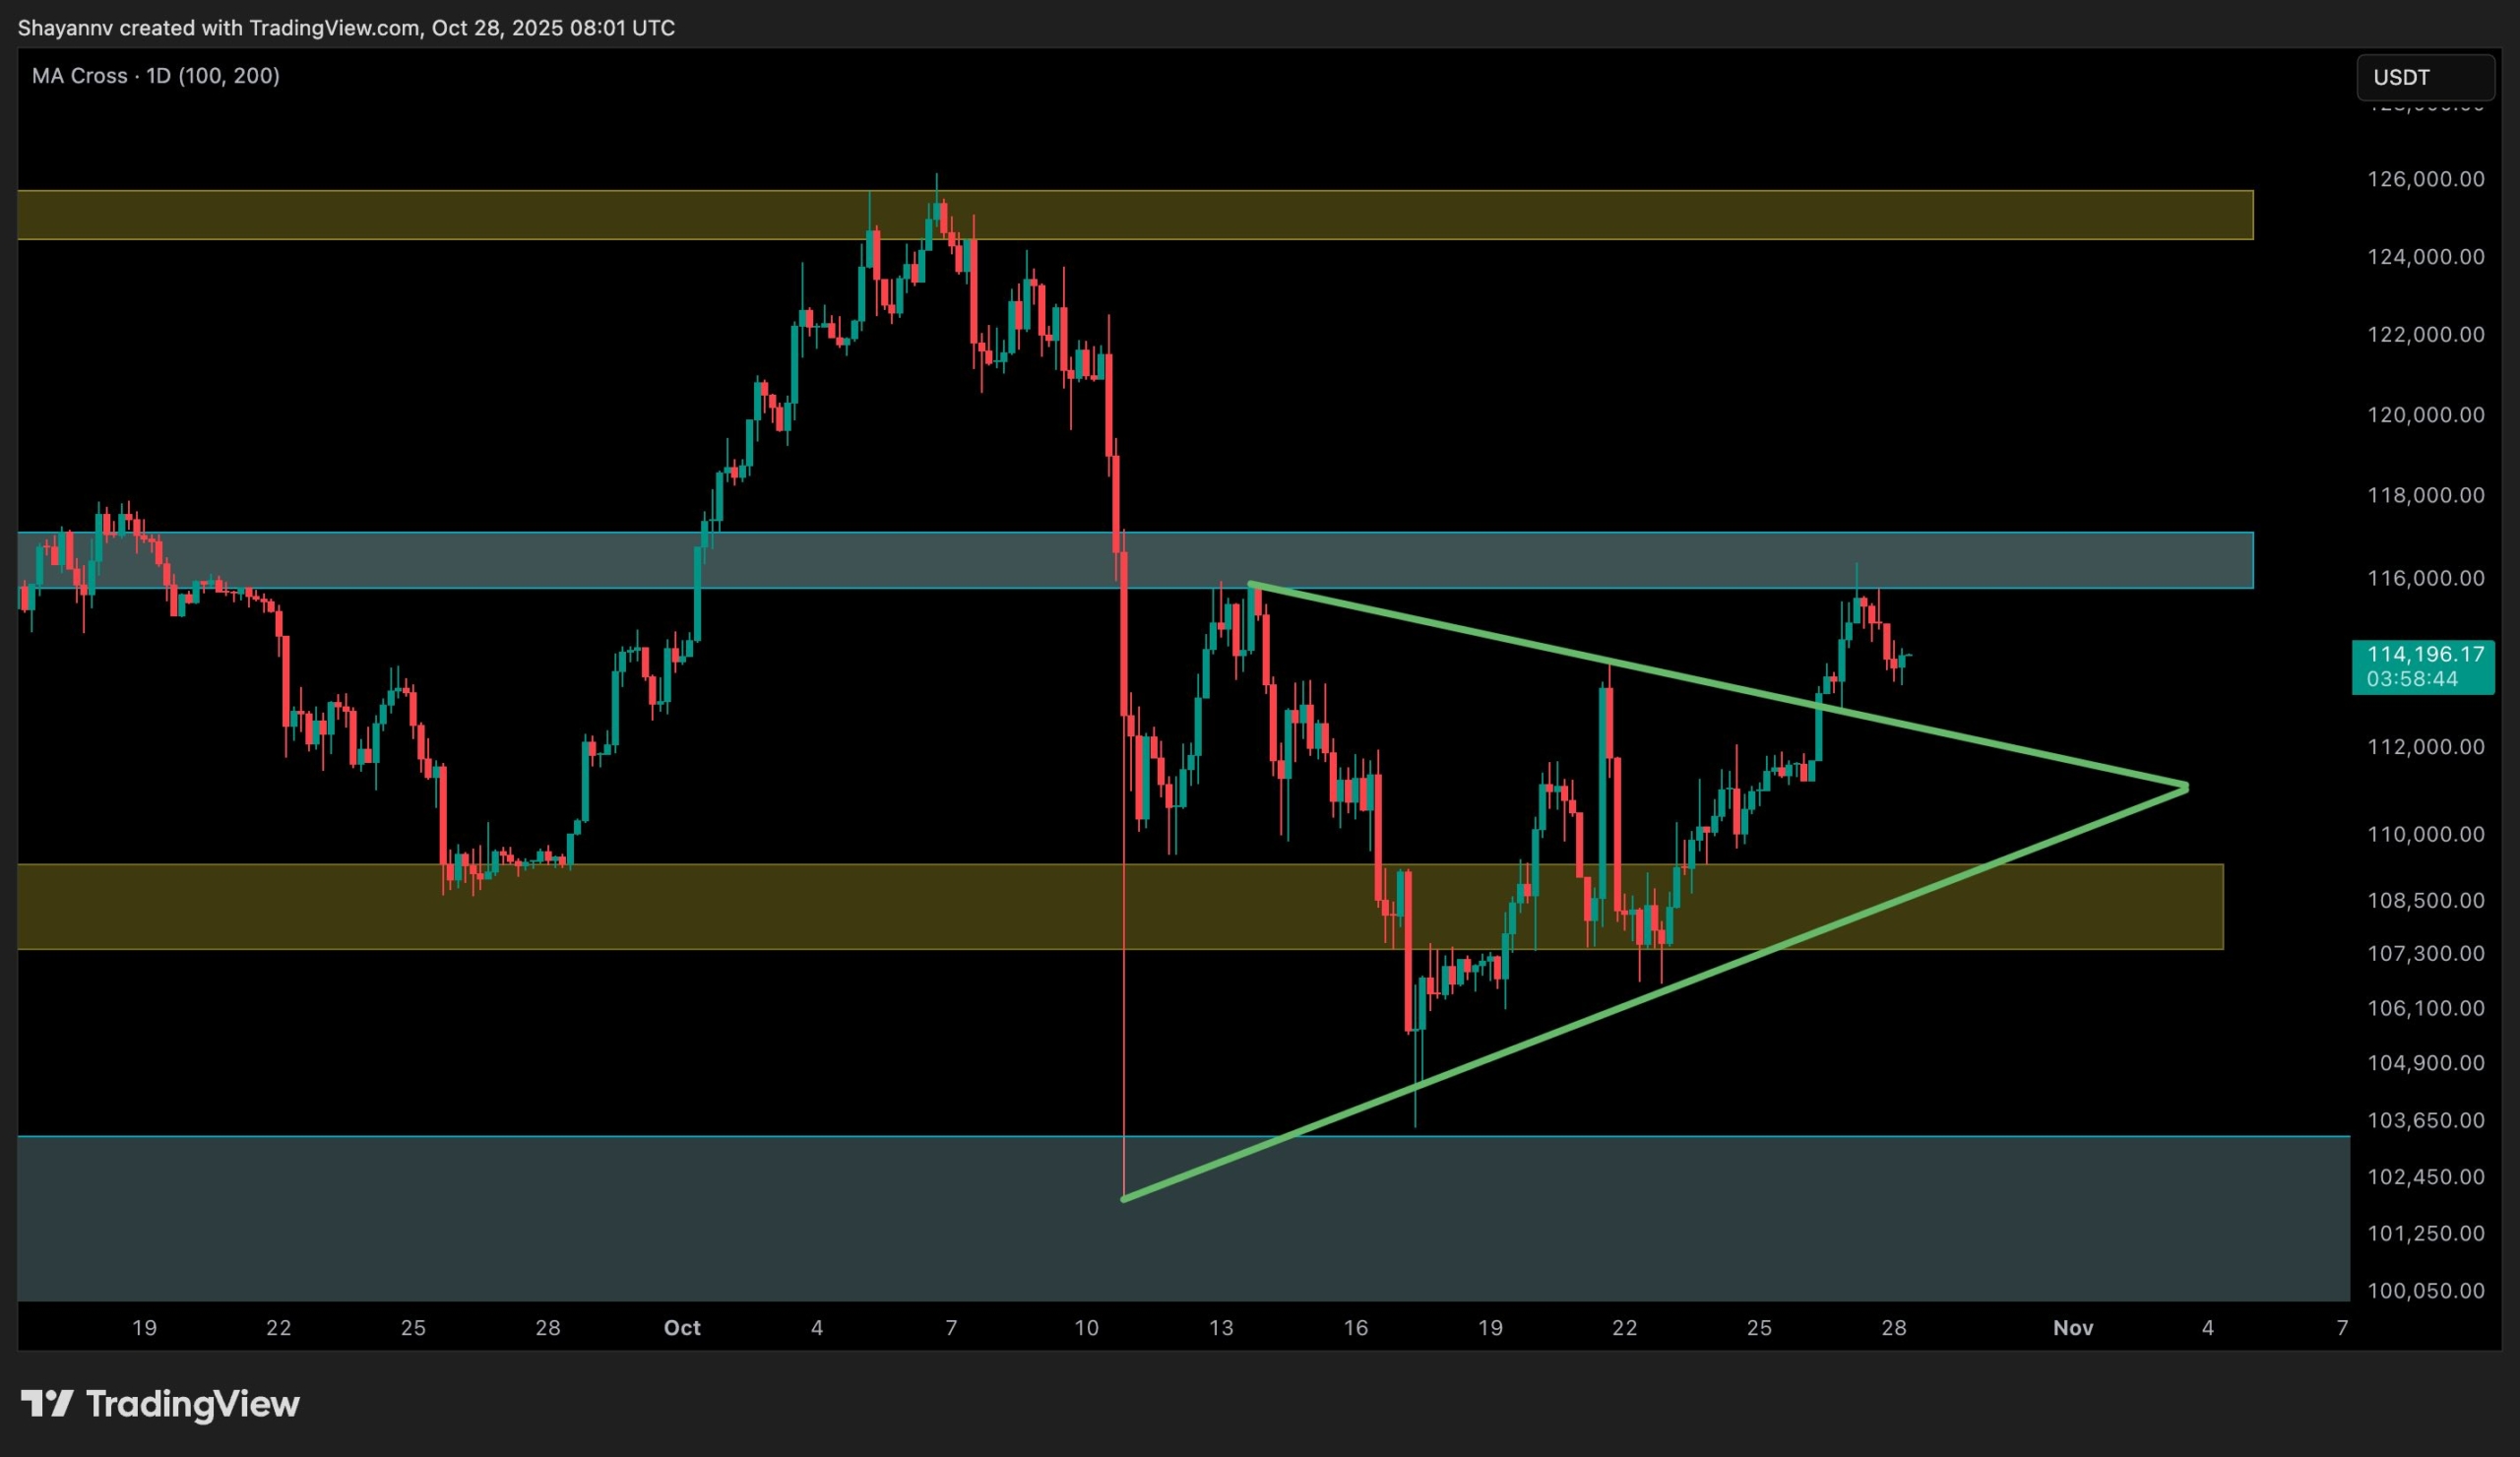
On the 4-hour chart, BTC has recently broken above a symmetrical triangle, showing renewed bullish momentum before pulling back slightly from resistance. The breakout pushed price into the $114K–$116K supply zone, where early signs of rejection are emerging.
If the price manages to stabilize above the upper boundary of the triangle (around $112K–$113K), the structure would remain constructive, allowing continuation toward the $118K–$120K zone. On the other hand, a breakdown below $111K would signal loss of short-term momentum, exposing the $108K demand area once again.
This setup reflects volatility compression near key levels, suggesting that a directional breakout, either reclaiming $116K or failing below $111K, will define Bitcoin’s short-term trajectory.
Sentiment Analysis
By Shayan
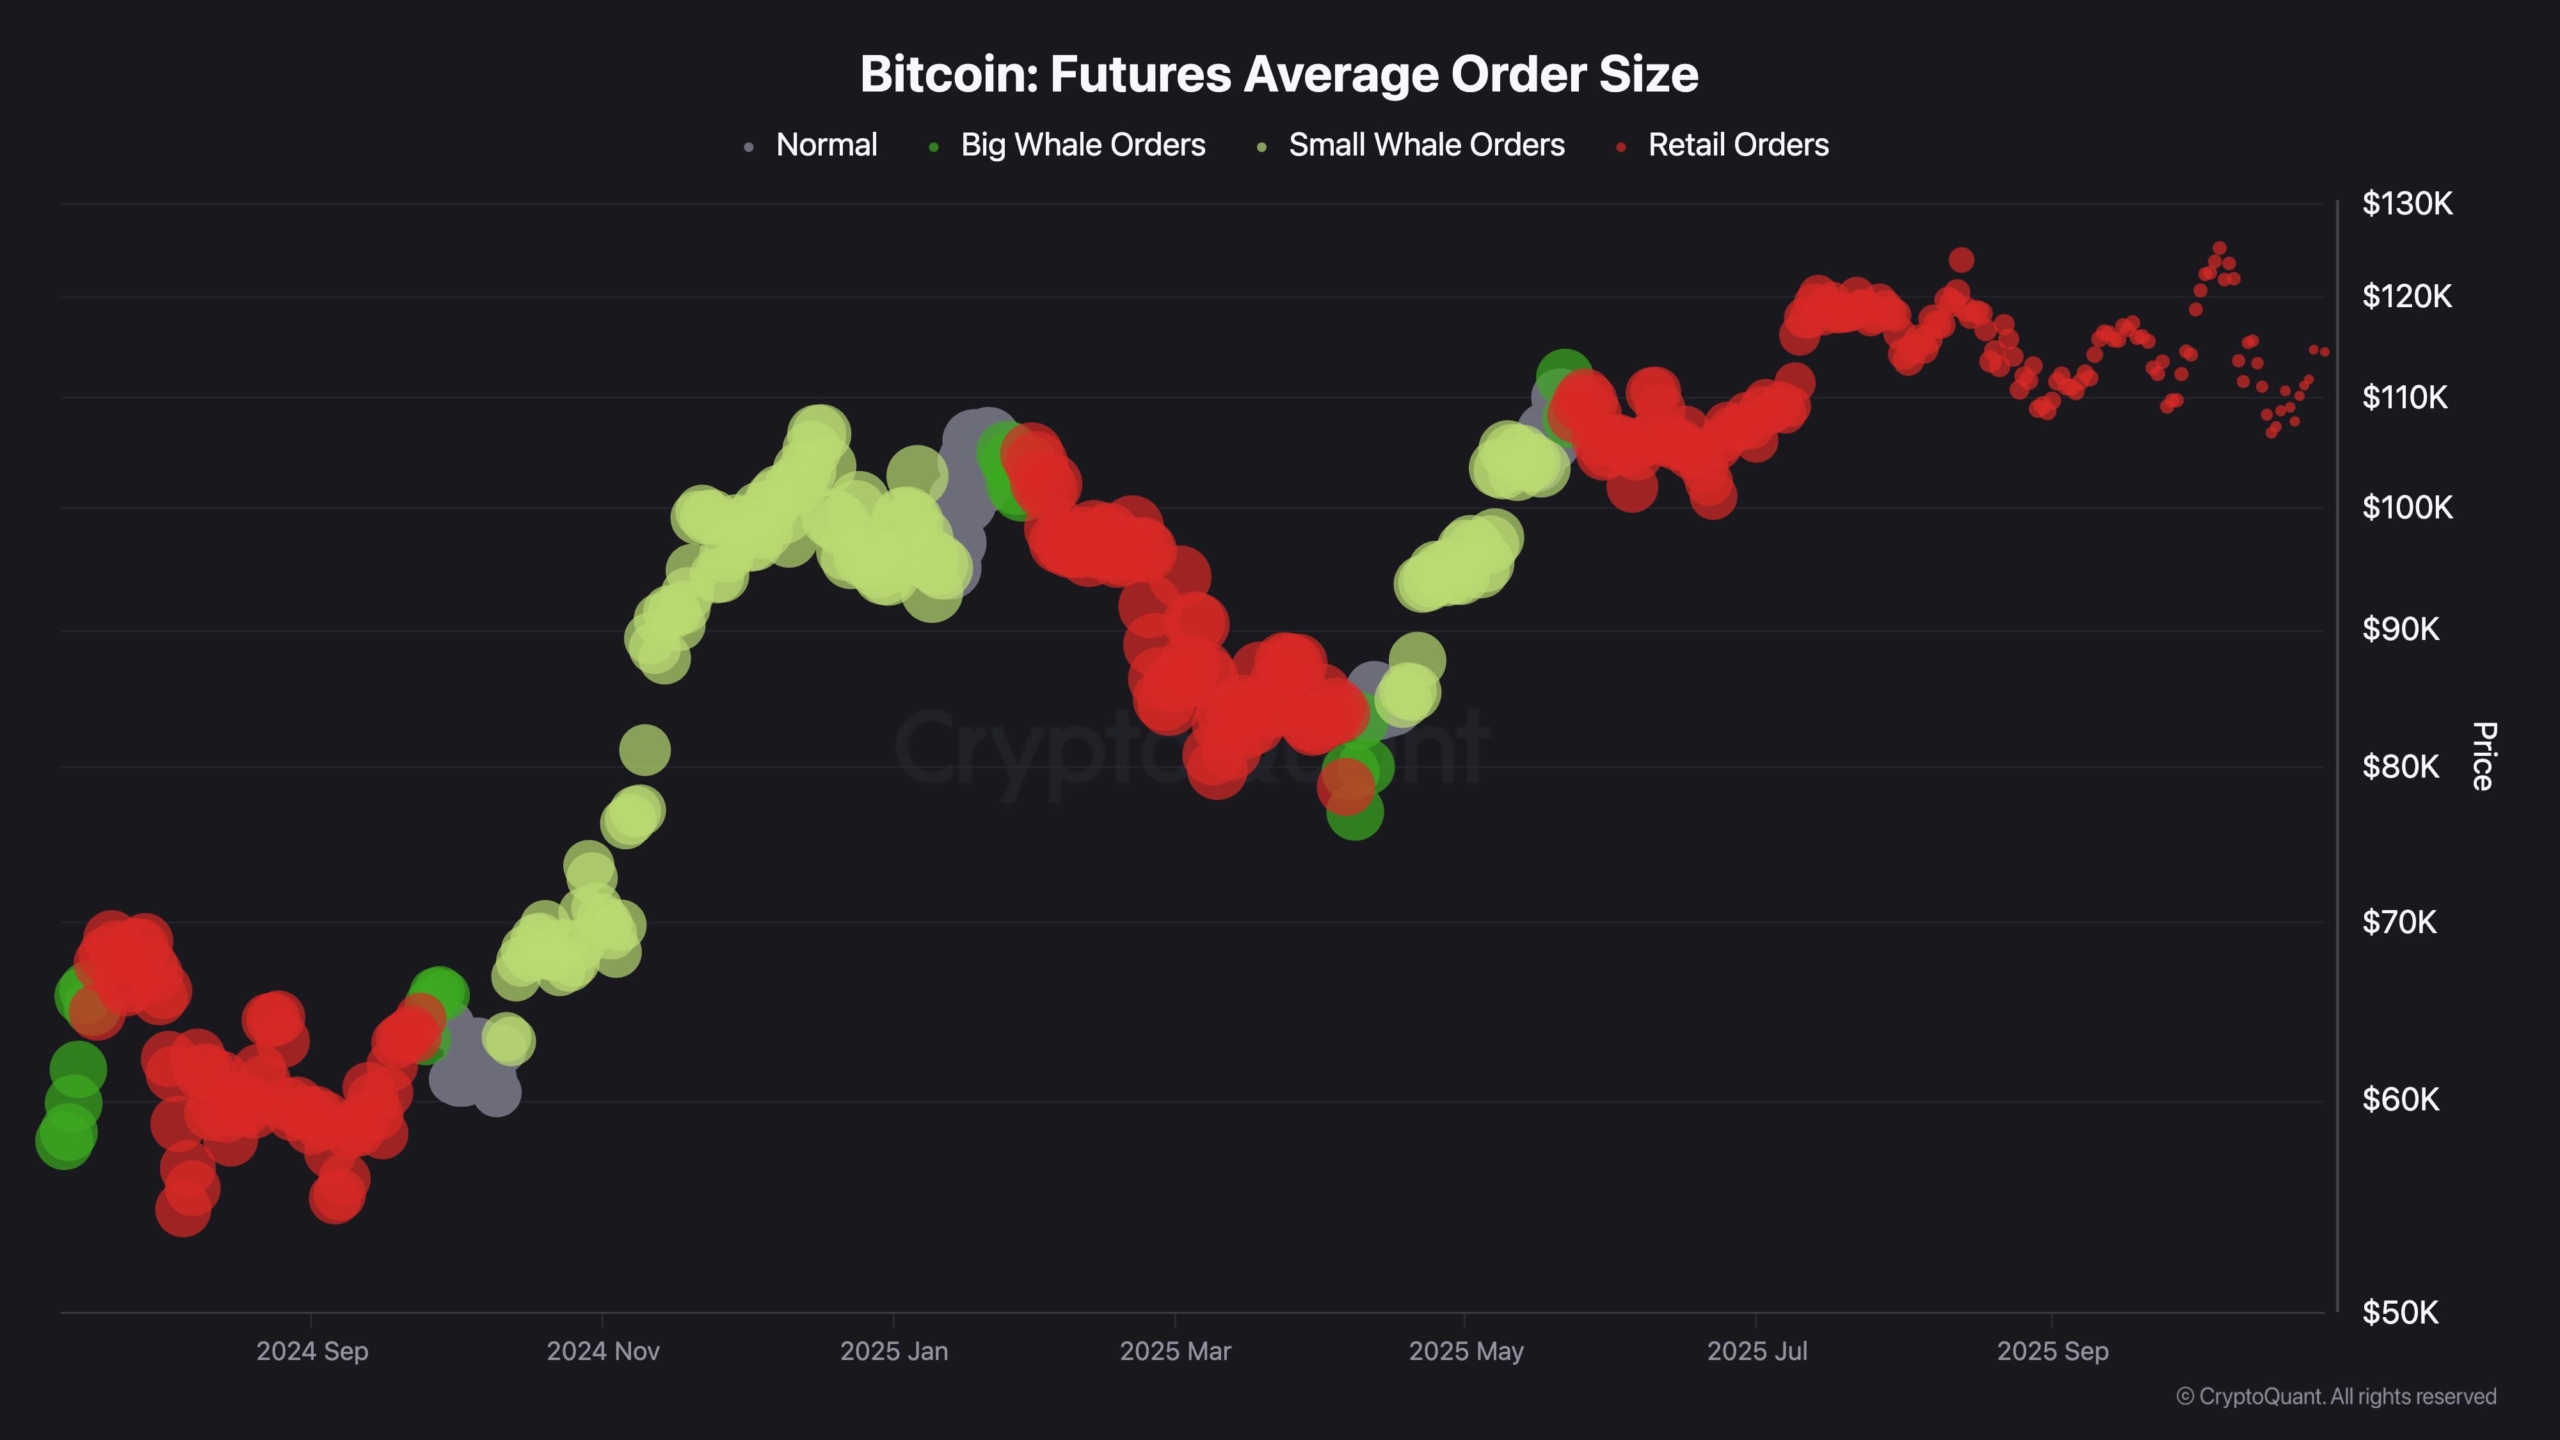
The Futures Average Order Size metric reveals a notable shift in market participation dynamics over recent weeks. During the recent rebound from the $108K–$109K demand zone, the market has seen a decline in large whale order activity (shown by the fading green clusters) and a corresponding increase in smaller retail-driven order sizes (highlighted in red).
This transition typically suggests that institutional traders are reducing leverage exposure and allowing retail participation to dominate short-term market movements, a common behavior during mid-range consolidations or the later phases of local recoveries.
Historically, phases of heavy retail dominance have often coincided with short-term distribution or range-bound price action, as large players wait to reaccumulate liquidity at lower levels. Conversely, periods where big whale orders expand sharply, as seen during late 2024 and early 2025, have preceded major directional rallies driven by institutional positioning.
At present, Bitcoin’s price is hovering near $114K, along with the contraction in large order size, indicating a neutral to cautious sentiment among professional traders. If a fresh influx of large orders reappears near the $109K–$110K support, it would signal renewed institutional accumulation and could reinforce the bullish continuation scenario toward $120K–$125K.
Until then, market structure suggests that Bitcoin is in a short-term equilibrium phase, where retail-driven volatility defines the range while institutional activity remains subdued, waiting for confirmation from key technical levels.
Binance Free $600 (CryptoPotato Exclusive): Use this link to register a new account and receive $600 exclusive welcome offer on Binance (full details).
LIMITED OFFER for CryptoPotato readers at Bybit: Use this link to register and open a $500 FREE position on any coin!
Disclaimer: Information found on CryptoPotato is those of writers quoted. It does not represent the opinions of CryptoPotato on whether to buy, sell, or hold any investments. You are advised to conduct your own research before making any investment decisions. Use provided information at your own risk. See Disclaimer for more information.
Cryptocurrency charts by TradingView.