- The value of XRP is at $2.09 with a 4% decrease, but trading volume increased by over 28%, indicating robust market demand.
- The technical indicators are neutral with XRP trading above $2.00, with the main resistance at $2.25.
XRP is currently trading at $2.09, down nearly 4% over 24 hours and 3.64% weekly as of Friday, 27th July. Despite the dip, daily trading volume surged by 28.37% to $3.32 billion, lifting the volume-to-market cap ratio to 2.69%.
The coin’s market cap stood at $123.5 billion, with XRP ranked number four overall. Analysts remain optimistic that this price activity signals an upcoming trend reversal, provided key support holds.
Bull Pennant and Volume Surge Signal Possible Upside
A renowned crypto analyst, EGRAG CRYPTO, noted in a post on X that XRP was still trading within a bull pennant formation at the time of writing, which is generally interpreted as a bullish extension model. The analyst pointed out that $1.95 remains a vital validation area. The bullish pattern can be maintained if XRP is set above this level.

The structure-based price targets provide the first breakout at $2.21 and the next at $2.40. The supporting trendlines and past breakouts support these levels, meaning the token is in a crucial stage. The current bullish volume of trades further affirms this setup, suggesting that new traders are interested in the trade even through short-term corrections.
Meanwhile, the Bollinger Band analysis on the chart indicates that XRP moves along the lower end near the center line, which is currently at $2.17. The lower band is at 2.02 and the upper at 2.32, providing a narrow trading range. A continued price movement above the mid-band may reestablish bullish movement.
Indicators Show Cautious Optimism but Await Confirmation
The technical indicators remain divided but are veering towards optimism. The Relative Strength Index (RSI) is currently at 43.15 and is below the neutral 50-line, suggesting a small bearish drive, but not oversold. The MACD has not yet crossed above the signal line, and the bars of the histogram are flat, meaning that the momentum is not strong but stable.

According to market analysts such as CasiTrades, the price has to crack through $2.25 and $2.69 to establish a complete bull trend. These are the 0.382 and 0.236 Fibonacci retracements that are based on the macro move. Until then, traders may view short-term rallies with caution. CasiTrades noted, “These are important macro levels and clearing them with strength would confirm that this isn’t just a local reaction, but a true trend shift!”
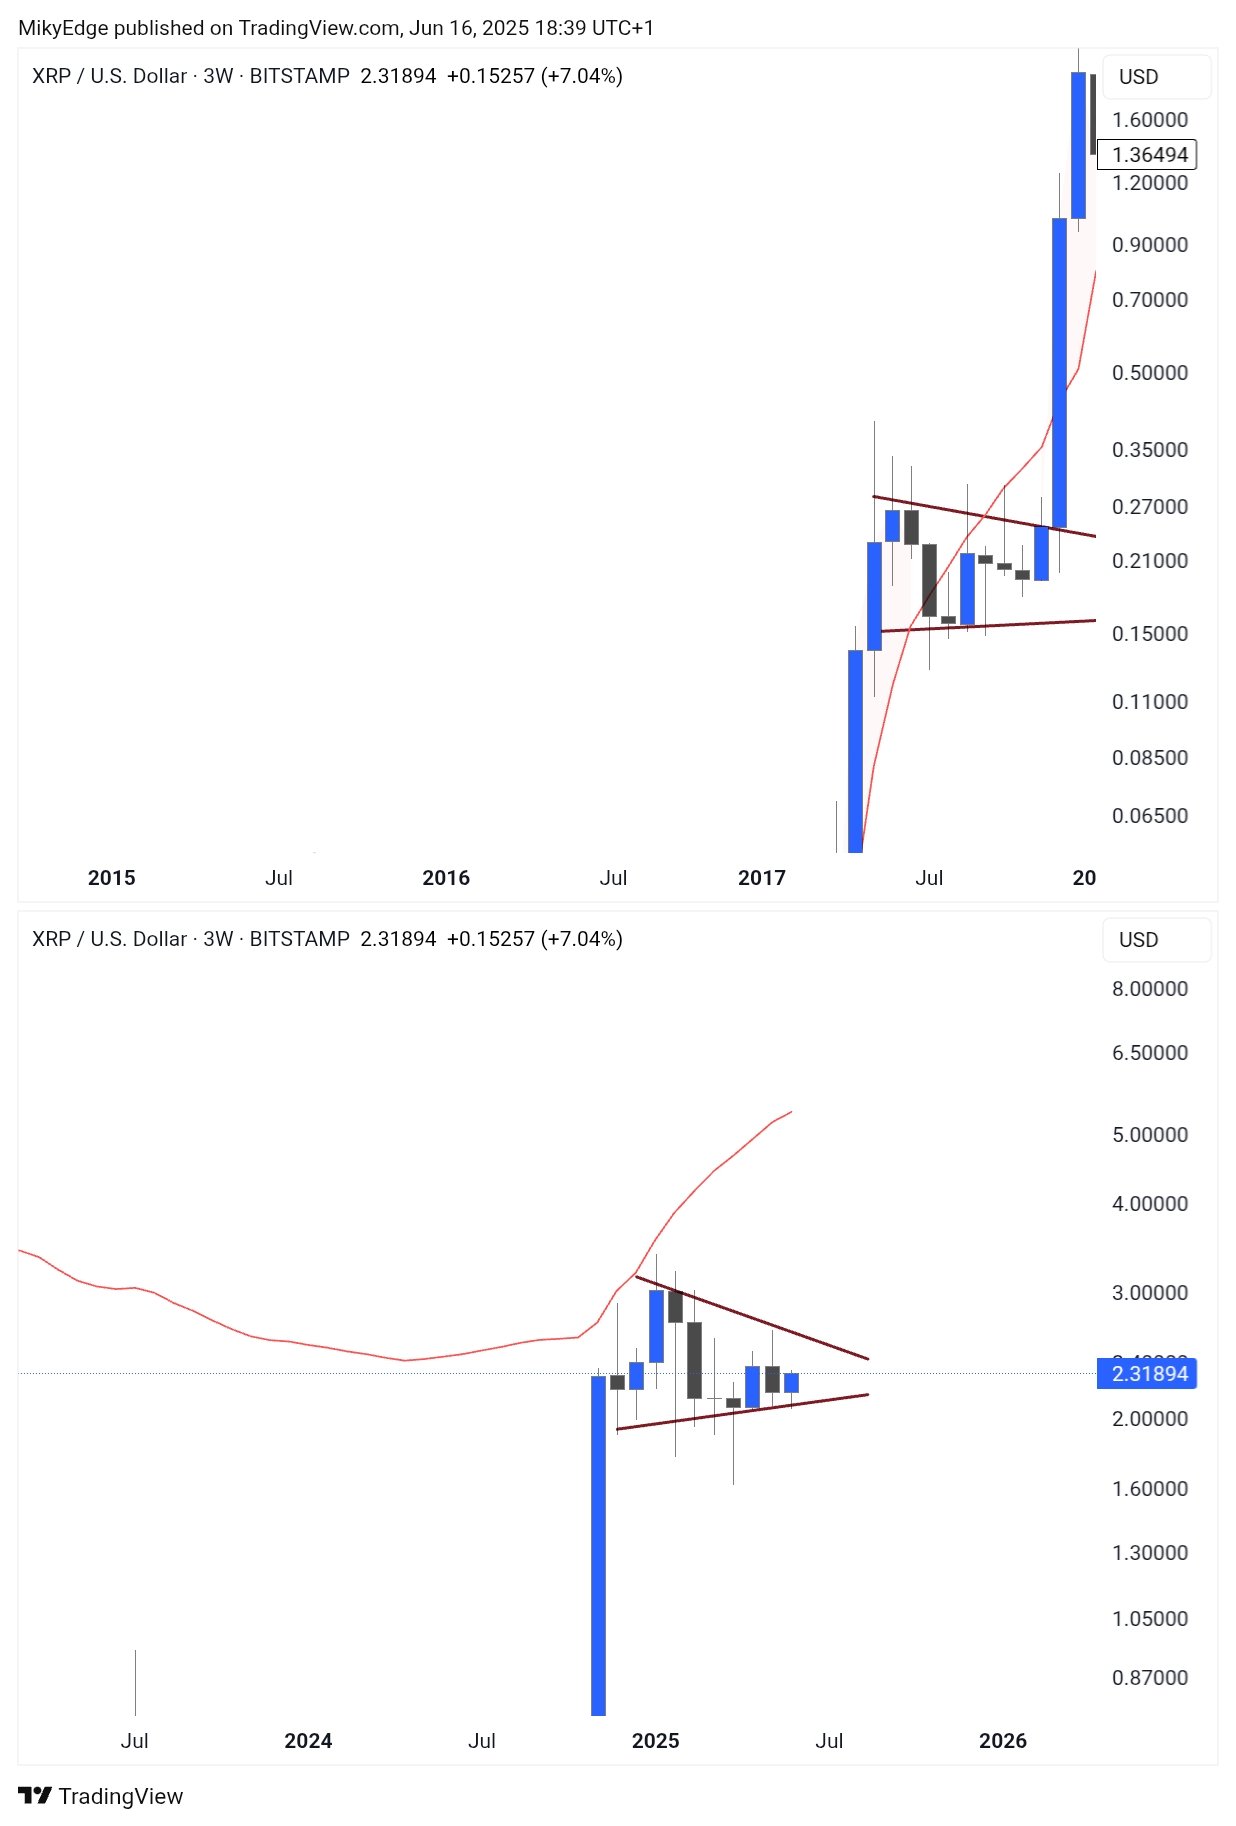
YouTuber DustyBC Crypto referred to XRP as incredibly cheap, below $2, and advised long-term holders to save at current prices. Another commentator, Mikybull Crypto, proposed the breakout of a larger symmetrical triangle, which would lead to an extended rally of historical XRP price levels as in 2017, with the target set at $14. He noted, “I HAVE SEEN THIS MOVIE BEFORE 2017 UPCOMING RALLY VIBES.”
The $1.95 level is a crucial support at the moment. Failure to hold it could eliminate the current pattern of pennants and leave room for losses. Positively, a rally beyond $2.21 and a breach above $2.40 would be a structural breakout wherein the negative trend changes to a more exhaustive bullish one.
Recently, Ripple, Inc., has lost an indicative order in its years-long legal challenge against the U.S. Securities and Exchange Commission (SEC), which came as the best possible scenario in the case.